One of the magical things that digital photography gives us is the ability to review an image instantly on the back of our cameras, or inside of an electronic viewfinder.
Frequently, one possible mistake that digital photographers make is when reviewing an image on their camera-they evaluate exposure based on the reproduced image. Why might this be a mistake? Well, both your camera's LCD and EVF likely have adjustable brightness. Also, you might be viewing your images in brigt sunlight or in the pitch black of night. Just as viewing a computer screen at work, or a television in your home, ambient light, screen brightness, and other factors affect the image that you view.
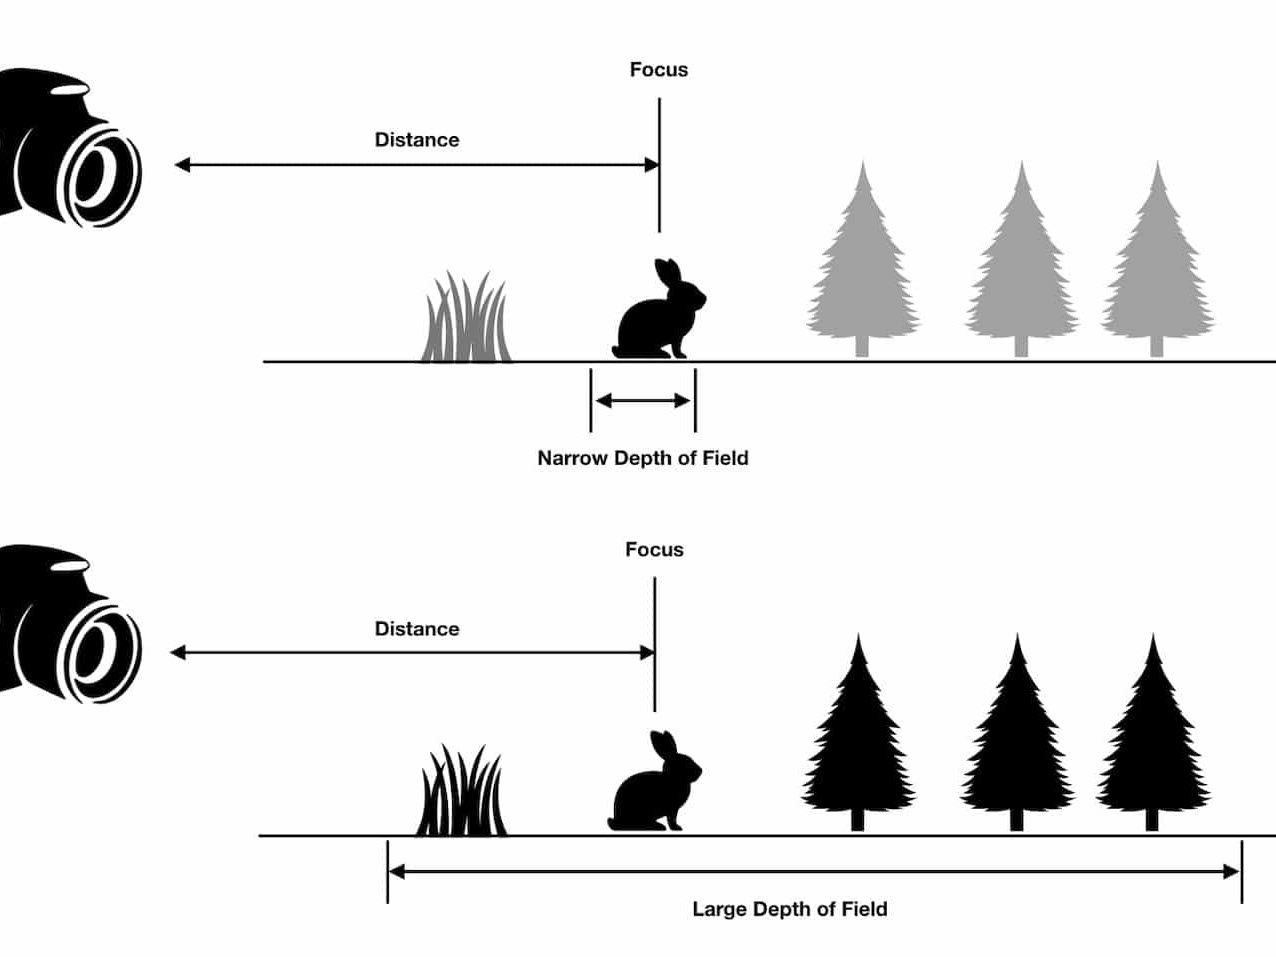
You should evaluate your LCD for composition and look to see if your depth of field, sharpness, and motion blur or freezing of action is what you were aiming for. Of course, if you have completely missed on your exposure, you may see that in an extremely bright or dark image.
So, how can we fine-tune our exposure if we cannot trust what our eyes see on the reproduced image? The answer is: the histogram. Luckily for us, the manufacturers of digital cameras have given us the histogram to use as a tool to evaluate exposure on a digital image more precisely.
Frequently, one possible mistake that digital photographers make is when reviewing an image on their camera-they evaluate exposure based on the reproduced image. Why might this be a mistake? Well, both your camera's LCD and EVF likely have adjustable brightness. Also, you might be viewing your images in brigt sunlight or in the pitch black of night. Just as viewing a computer screen at work, or a television in your home, ambient light, screen brightness, and other factors affect the image that you view.
You should evaluate your LCD for composition and look to see if your depth of field, sharpness, and motion blur or freezing of action is what you were aiming for. Of course, if you have completely missed on your exposure, you may see that in an extremely bright or dark image.
So, how can we fine-tune our exposure if we cannot trust what our eyes see on the reproduced image? The answer is: the histogram. Luckily for us, the manufacturers of digital cameras have given us the histogram to use as a tool to evaluate exposure on a digital image more precisely.
Most modern digital cameras have four histograms. The primary one is the luminosity histogram that shows overall brightness of a scene. This histogram usually has a monochromatic display-either white data on a black chart, or vice versa. The other three histograms are the color histograms, representing the red-, green-, and blue-sensitive pixels on the sensor. These histograms are generally displayed in their respective color.
(It may help to have your digital camera with you while you read this article, so that you can figure out how to find your camera's histogram and interpret it. Digital cameras from different manufacturers have different menus, interfaces, and settings that govern when and where your histogram or histograms will appear.
How to Read the Histogram
This histogram's horizontal (X) axis shows the luminance of the image from pure black on the left edge of the graph to pure white on the right edge. Growth on the vertical (Y) axis indicates the relative quantity of light for the given luminance. To illustrate the functionality using an extreme example, take a photo with your lens cap on and you will produce a histogram that has one spike, from bottom to top, on the left edge of the histogram. Opposite of this, take a long exposure on a sunny day and you will achieve a spike on the right. An image with a balanced exposure will show a "hump" in the middle region of the chart that tapers off as you move left toward black or right toward white.
This middle region of the histogram is for midtone luminance-the gray area(s) between black and white. You may have heard of "50 Shades of Gray." Your camera, if it does 8-bit sampling, has 255 shades of gray. If you must visualize numbers, the X-axis of the histogram goes from 0 (black) to 255 (white) as you move from left to right.
How to read it: The histogram basically shows you the brightness of an image. If you take an image and see the majority of the body of the graph toward the right, this means you have captured a "high-key" image that may appear overexposed. Opposite, a histogram with the data showing mostly on the left is a "low-key" image that might appear underexposed. If you are making an image of a high-contrast scene (very dark and bright areas), you might see a U-shaped histogram. There are almost infinite combinations of light and dark that will register on the histogram.
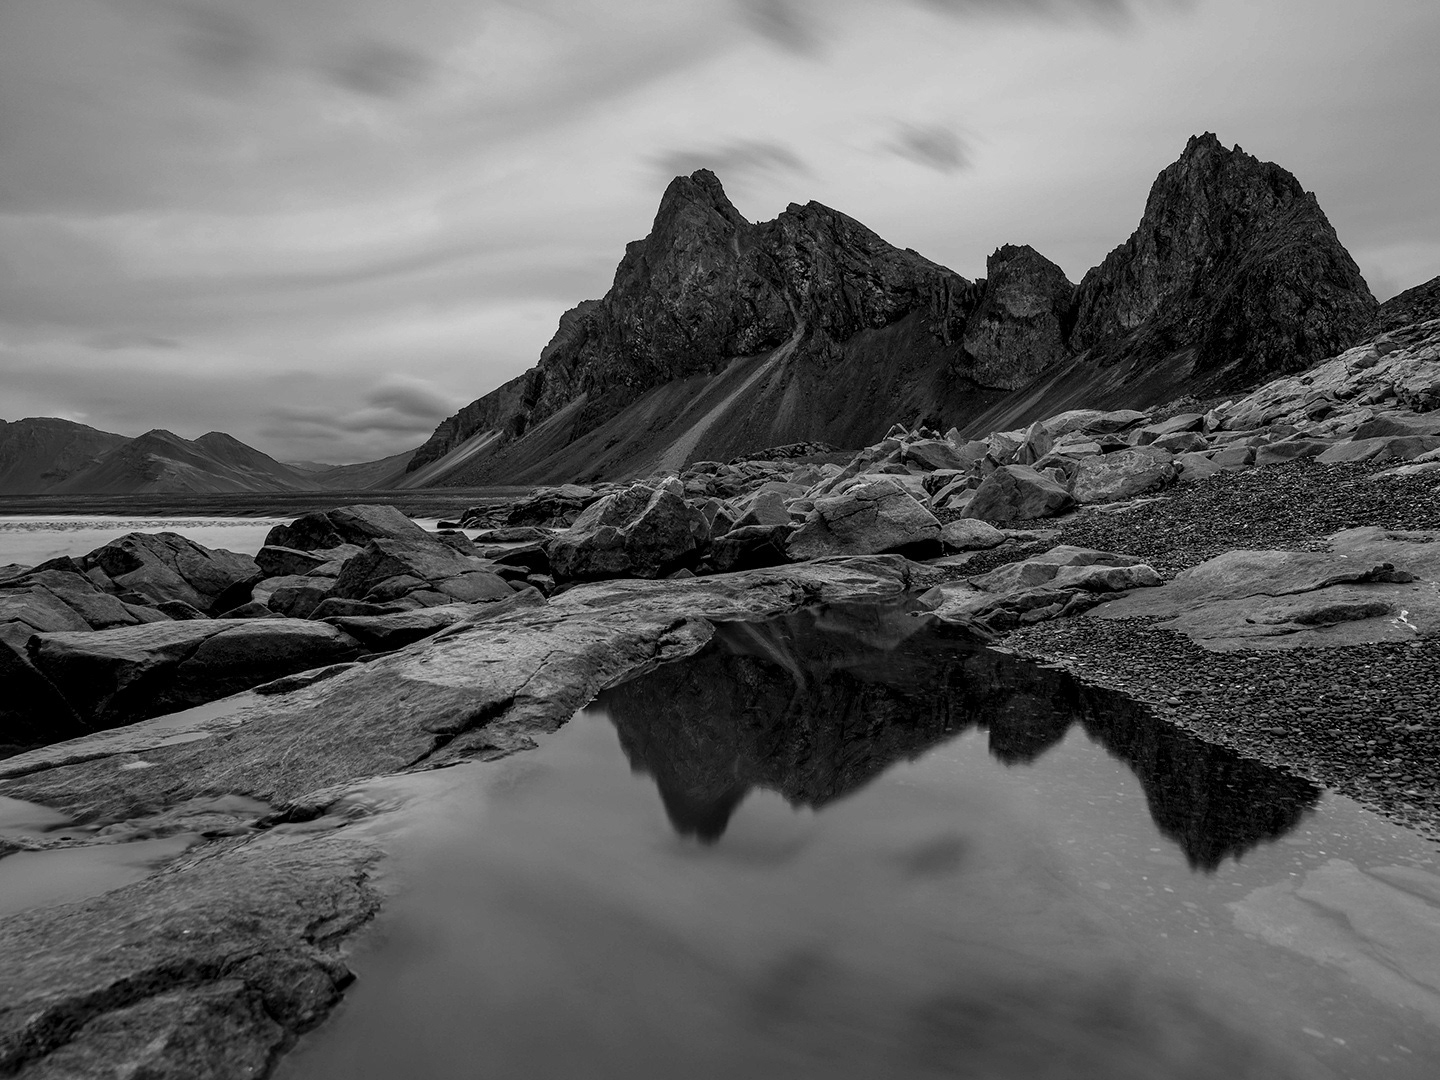
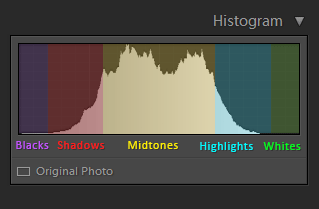
Here is an example of a histogram for a properly exposed photo.
As you can see, the histogram indicates that the image does not have pure black pixels or pure white pixels. Most of the pixels are distributed among darks, midtones, and highlights.
Underexposed Capture
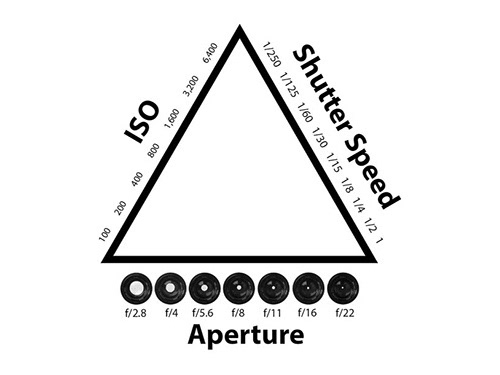
Now, see how the histogram looks when I underexposed the shot by one stop. I used the Shutter Speed value at 1/1000 sec instead of 1/500 sec. The rest of the settings are the same.
Underexposed Capture
Now, see how the histogram looks when I underexposed the shot by one stop. I used the Shutter Speed value at 1/1000 sec instead of 1/500 sec. The rest of the settings are the same.
As you can see, the histogram indicates that the image does not have pure black pixels or pure white pixels. Most of the pixels are distributed among darks, midtones, and highlights.
Underexposed Capture
Now, see how the histogram looks when I underexposed the shot by one stop. I used the Shutter Speed value at 1/1000 sec instead of 1/500 sec. The rest of the settings are the same.
Underexposed Capture
Now, see how the histogram looks when I underexposed the shot by one stop. I used the Shutter Speed value at 1/1000 sec instead of 1/500 sec. The rest of the settings are the same.
As you can see, the histogram is shifted to the left, which indicates that most of the image’s pixels are distributed in Black or the Shadows. This indicates an “underexposed“ image.
Overexposed Capture
And here is the exactly the same photo taken with the Shutter Speed value of 1/250 sec. The rest of the settings are the same.
It is clear that pixel distribution sifted towards Highlights and Whites. This indicates an “overexposed“ image.
Histogram Clipping
In general, pure black and pure white colors are rare in nature. When your photograph has pure black or pure white colors it often indicates problems caused by the wrong exposure.
If the histogram touches the left edge of the diagram, it means that your image has pure black pixels. This is called “Shadow Clipping.” Pure black pixels have no color information making it impossible to recover in post processing.
The same logic applies when the histogram touches the right edge of the diagram, which indicates that the image has pure white pixels. This is called “Highlight Clipping” where the color information is lost forever.
When you evaluate the histogram and see Shadow Clipping or Highlight Clipping, it almost certainly means that the exposure value is wrong. You should adjust the settings to increase the exposure if you encounter Shadow Clipping or reduce the exposure if you encounter Highlight Clipping.
Conclusion
Do not be afraid of or intimidated by the histogram. If you understand the logic behind it, it will become a very simple and reliable tool for getting the right exposure with every shot you take. When reviewing your images, be sure to base your exposure adjustments moving forward on the histogram data, look for clipping and blinkies, and do not judge an exposure based on the camera preview image.